The Boston real estate market in Q2 2024 has showcased a dynamic mix of growth, demand, and variability across different property types and neighborhoods. Analysis of the latest data from MLS PIN for both condominiums and single-family homes provides a comprehensive picture of the market conditions. While single-family homes have generally appreciated in value and sold faster, the condominium market presents a more nuanced picture with both growth and declines. Key neighborhoods such as the South End and Back Bay have exhibited particularly interesting trends, reflecting the broader complexities of the market. Despite broader economic fluctuations, the market maintained its appeal, driven by the city’s strong economic fundamentals and diverse neighborhood offerings.
For the purpose of this report, Boston includes; Allston, Back Bay, Bay Village, Beacon Hill, Brighton, Charlestown, Chinatown–Leather District, Dorchester, East Boston, Fenway-Kenmore, Jamaica Plain, Midtown, Mission Hill, North End, Roslindale, Roxbury, Seaport, South Boston, South End, Waterfront, West End, West Roxbury.
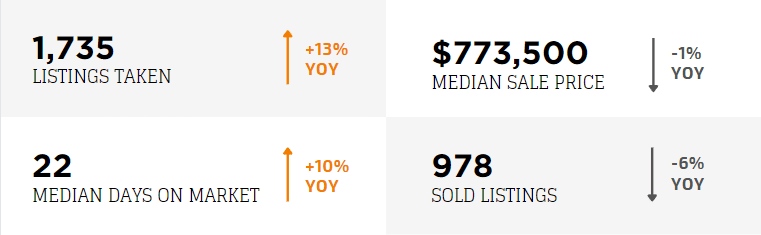
The condominium market in Boston for Q2 2024 also showed significant changes. There were 1,735 condominium listings taken, representing a 13% YoY increase from Q2 2023. The median sale price for condominiums slightly decreased by 1% to $773,500. The median DOM for condominiums increased by 10% to 22 days, while the number of sold listings fell by 6% to 978. This indicates a more tempered market for condominiums compared to single-family homes.
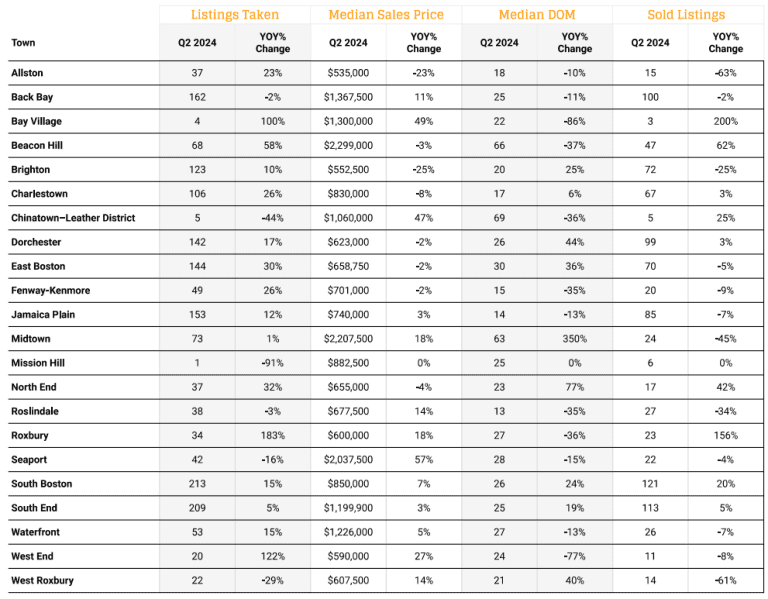
In Back Bay, the trends varied significantly. The neighborhood saw a 2% decline in listings taken, with 162 properties listed. The median sale price in Back Bay increased by 11% to $1,367,500, and the median DOM decreased by 11% to 25 days, indicating strong demand. In the South End, condominium listings taken rose by 5% YoY to 209, with a median sale price of $1,199,900, up by 3%. The median DOM in South End decreased by 19% to 25 days, though the number of sold listings fell by 5% to 113.
Soucre: MLS Pin 04/01/24-06/30/24. For the purpose of this report, Boston includes; Allston, Back Bay, Bay Village, Beacon Hill, Brighton, Charlestown, Chinatown–Leather District, Dorchester, East Boston, Fenway-Kenmore, Jamaica Plain, Midtown, Mission Hill, North End, Roslindale, Roxbury, Seaport, South Boston, South End, Waterfront, West End, West Roxbury.
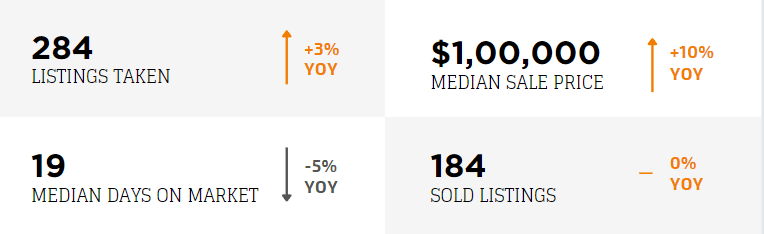
The Boston real estate market for single-family homes in Q2 2024 showed notable growth and demand. There were 284 single-family home listings taken, marking a 3% year-over-year (YoY) increase. The median sale price for these homes rose by 9% to reach $1,000,000. Additionally, the median days on market (DOM) for single-family homes decreased by 5% to just 19 days, indicating a robust demand. However, the number of sold listings remained steady at 184, showing no change from the previous year.
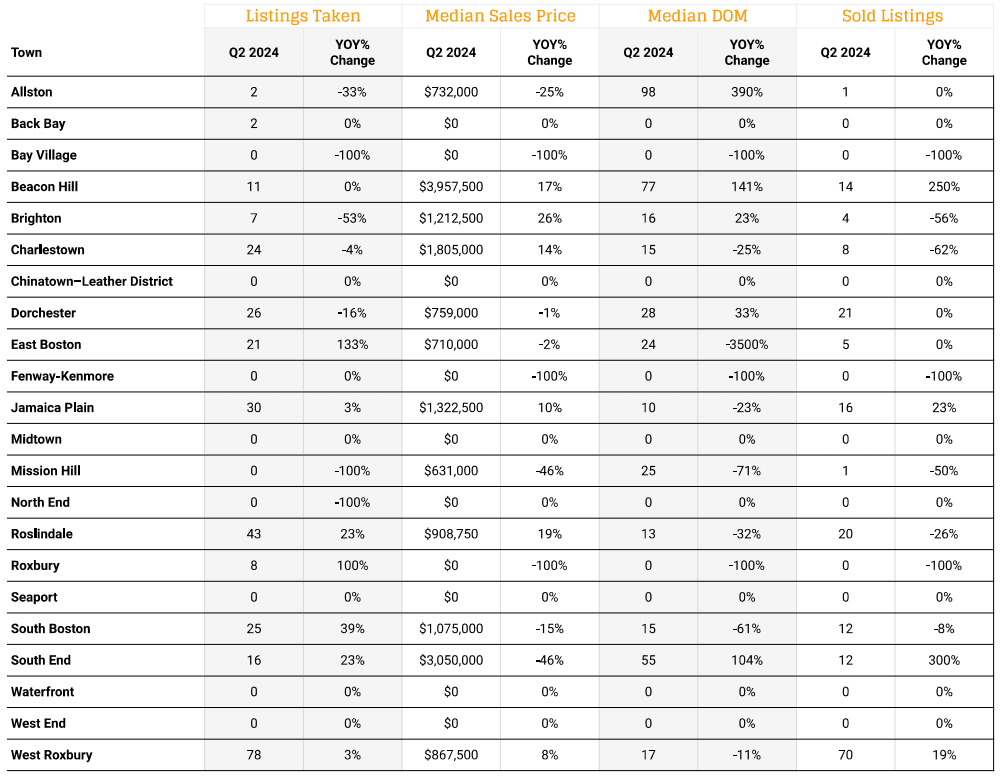
In the South End, significant activity was observed. The number of listings taken in this neighborhood increased by 23% YoY to 16, with a median sale price of $3,050,000, despite a 46% decline in price. The median DOM in South End surged by 104% to 55 days, while sold listings saw an impressive 300% increase, indicating a vibrant market despite price fluctuations. On the other hand, Allston experienced a 33% decline in listings taken, with only two properties listed. The median sale price in Allston dropped by 25% to $732,000, and the median DOM increased substantially to 98 days, reflecting a slowdown in this neighborhood.
Soucre: MLS Pin 04/01/24-06/30/24. For the purpose of this report, Boston includes; Allston, Back Bay, Bay Village, Beacon Hill, Brighton, Charlestown, Chinatown–Leather District, Dorchester, East Boston, Fenway-Kenmore, Jamaica Plain, Midtown, Mission Hill, North End, Roslindale, Roxbury, Seaport, South Boston, South End, Waterfront, West End, West Roxbury.
The Boston real estate market in Q2 2024 has demonstrated a variety of market drivers across different neighborhoods. Utilizing data from MLS PIN for the period of April 1, 2024, to June 30, 2024, we can identify several key factors influencing the market dynamics in Boston proper areas, which include Allston, Back Bay, Bay Village, Beacon Hill, Brighton, Charlestown, Chinatown–Leather District, Dorchester, East Boston, Fenway-Kenmore, Jamaica Plain, Midtown, Mission Hill, North End, Roslindale, Roxbury, Seaport, South Boston, South End, Waterfront, West End, and West Roxbury.
The Boston real estate market in Q2 2024 presents a complex yet promising landscape for both buyers and sellers. The dynamics between single-family homes and condominiums highlight the varied opportunities and challenges within the market. While single-family homes continue to appreciate in value and sell quickly, the condominium market shows more tempered growth with fluctuations in prices and sales volume. Key neighborhoods like the South End and Back Bay illustrate broader market trends, with strong demand and varying levels of price appreciation.
Despite economic fluctuations, Boston’s strong economic fundamentals and diverse neighborhood offerings continue to drive the market’s appeal. As we move forward, staying informed and adaptable will be crucial for navigating this ever-evolving market. Whether you’re a first-time homebuyer, a seasoned investor, or a seller looking to capitalize on current trends, Boston’s real estate market offers a wealth of opportunities.
The information contained in this report is based on data obtained from various sources, including Boston Planning & Development Agency, Massachusetts Association of Realtors, MLS Property Information Network, Zillow Research, Redfin Data Center, CoStar Group, Boston Real Estate Times, and the Massachusetts Department of Housing and Community Development. While every effort has been made to ensure the accuracy of the information, it is provided “as is” without any warranty of any kind, either express or implied.
Readers are encouraged to verify any information through independent sources and consult with a qualified real estate professional before making any decisions based on the content of this report. The author and publisher of this report assume no responsibility or liability for any errors, omissions, or inaccuracies, or for any actions taken by readers based on the information provided.
Real estate markets are subject to rapid changes due to a variety of factors, and the data presented here may not reflect the most current market conditions. This report is intended for informational purposes only and should not be construed as financial, legal, or investment advice

